使用ftrace分析两时间点间隔
2018-02-03
1. 使用 python 提取出 interval
# -*- coding: utf-8 -*

#添加相应trace_printk, ftrace输出类似:
#           <...>-3084  [000] 352166.459260: your_func_01: your_point_01
#           <...>-2892  [000] 352166.459529: your_func_02: your_point_02

read_point_start = 1
f_in=open('interval.ftrace', 'r')
f_out = open("interval.dat", "wb")
line_no = 1

while 1:
    line = f_in.readline()
    if not line:
        break
    #print line

    if read_point_start == 1:
        if "your_func_01" in line:
            val_point_start=line.split(":")[0].split(" ")[-1]
            read_point_start = 0
            print val_point_start,
    elif "your_func_02" in line:
            val_point_end=line.split(":")[0].split(" ")[-1]
            print val_point_end,
            interval = int((float(val_point_end) - float(val_point_start)) * 1000 * 1000)
            print interval
            f_out.write(str(line_no) + " " + str(interval)+'\n')
            line_no+=1
            read_point_start = 1

f_out.close()
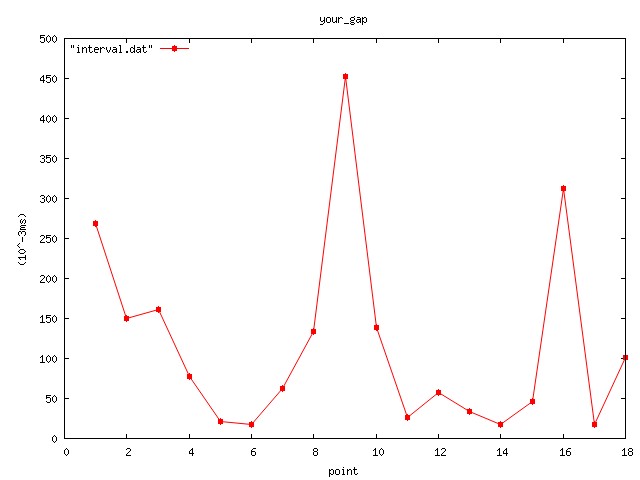
2. 输出文件内容 interval.dat
1 269
2 150
3 161
4 78
5 21
6 18
7 63
8 134
9 453
10 139
11 26
12 57
13 34
14 18
15 46
16 312
17 17
18 101
3. your_plot_cmds.plt内容
set terminal jpeg small
set output "gnuplot_interval.jpg"
#set terminal png
#set output "interval.png"

#set key right bottom
set key left top
#set key 6,100

set xlabel "point"
set ylabel "(10^-3ms)"
set title "cnt"

#set xrange [0.5:12.5]
#set xtics 1, 1, 12
plot "interval.dat" with linespoints pointtype 7  pointsize 1

set output
unset key
4. 运行gnuplot
gnuplot your_plot_cmds.plt
效果:
本文地址: https://awakening-fong.github.io/posts/debug/ftrace_data_analysis_interval
转载请注明出处: https://awakening-fong.github.io
若无法评论, 请打开JavaScript, 并通过proxy.
blog comments powered by Disqus